Introduction
UFOs, or unidentified flying objects, are
objects or lights that appear in the sky and
cannot be easily explained by conventional means. These sightings have been
reported for centuries, with some of the earliest recorded sightings dating back to
ancient civilizations. However, the term "UFO" was not coined until the 1950s,
when the US Air Force began investigating reports of flying saucers and other strange
phenomena.
There are many different theories behind UFOs, ranging from the idea that they are
advanced technology developed by other civilizations to the belief that they are
secret government projects. Some people also believe that UFO sightings are evidence of
extraterrestrial life, while others argue that they are simply misidentified
natural phenomena or man-made objects.
Despite the lack of concrete evidence, UFOs continue to be a topic of interest for many
people around the world. This is partly due to the fact that numerous sightings are
reported by reliable witnesses, such as pilots and military personnel. Additionally,
some people are drawn to the idea of extraterrestrial life and the possibility of
contact with other civilizations.
Over the years, there have been dozens, and perhaps even hundreds, of stories and UFO
sightings that have become worldwide phenomena, inspiring movies and turning those
involved into international icons. Some of the most popular stories could be found
below:
Regardless of the validity of these
stories, one cannot deny the sheer intrigue and
excitement they bring to the table. The possibility of otherworldly beings visiting
our
planet has captured the imagination of people from all walks of life, encouraging us
to question the very fabric of our reality and search for meaning beyond our limited
understanding. From stories of alien abductions to encounters with otherworldly
crafts, the UFO conversation has truly expanded our horizons and challenged our
perceptions
of what is possible.
So, whether you're a skeptic or a believer, there's no denying that the UFO
conversation is a fascinating and endlessly captivating topic that continues to
inspire us to dream big and imagine beyond the confines of our current knowledge.
After all, in a universe as vast and mysterious as ours, who knows what incredible
discoveries await us in the vast expanse of space?
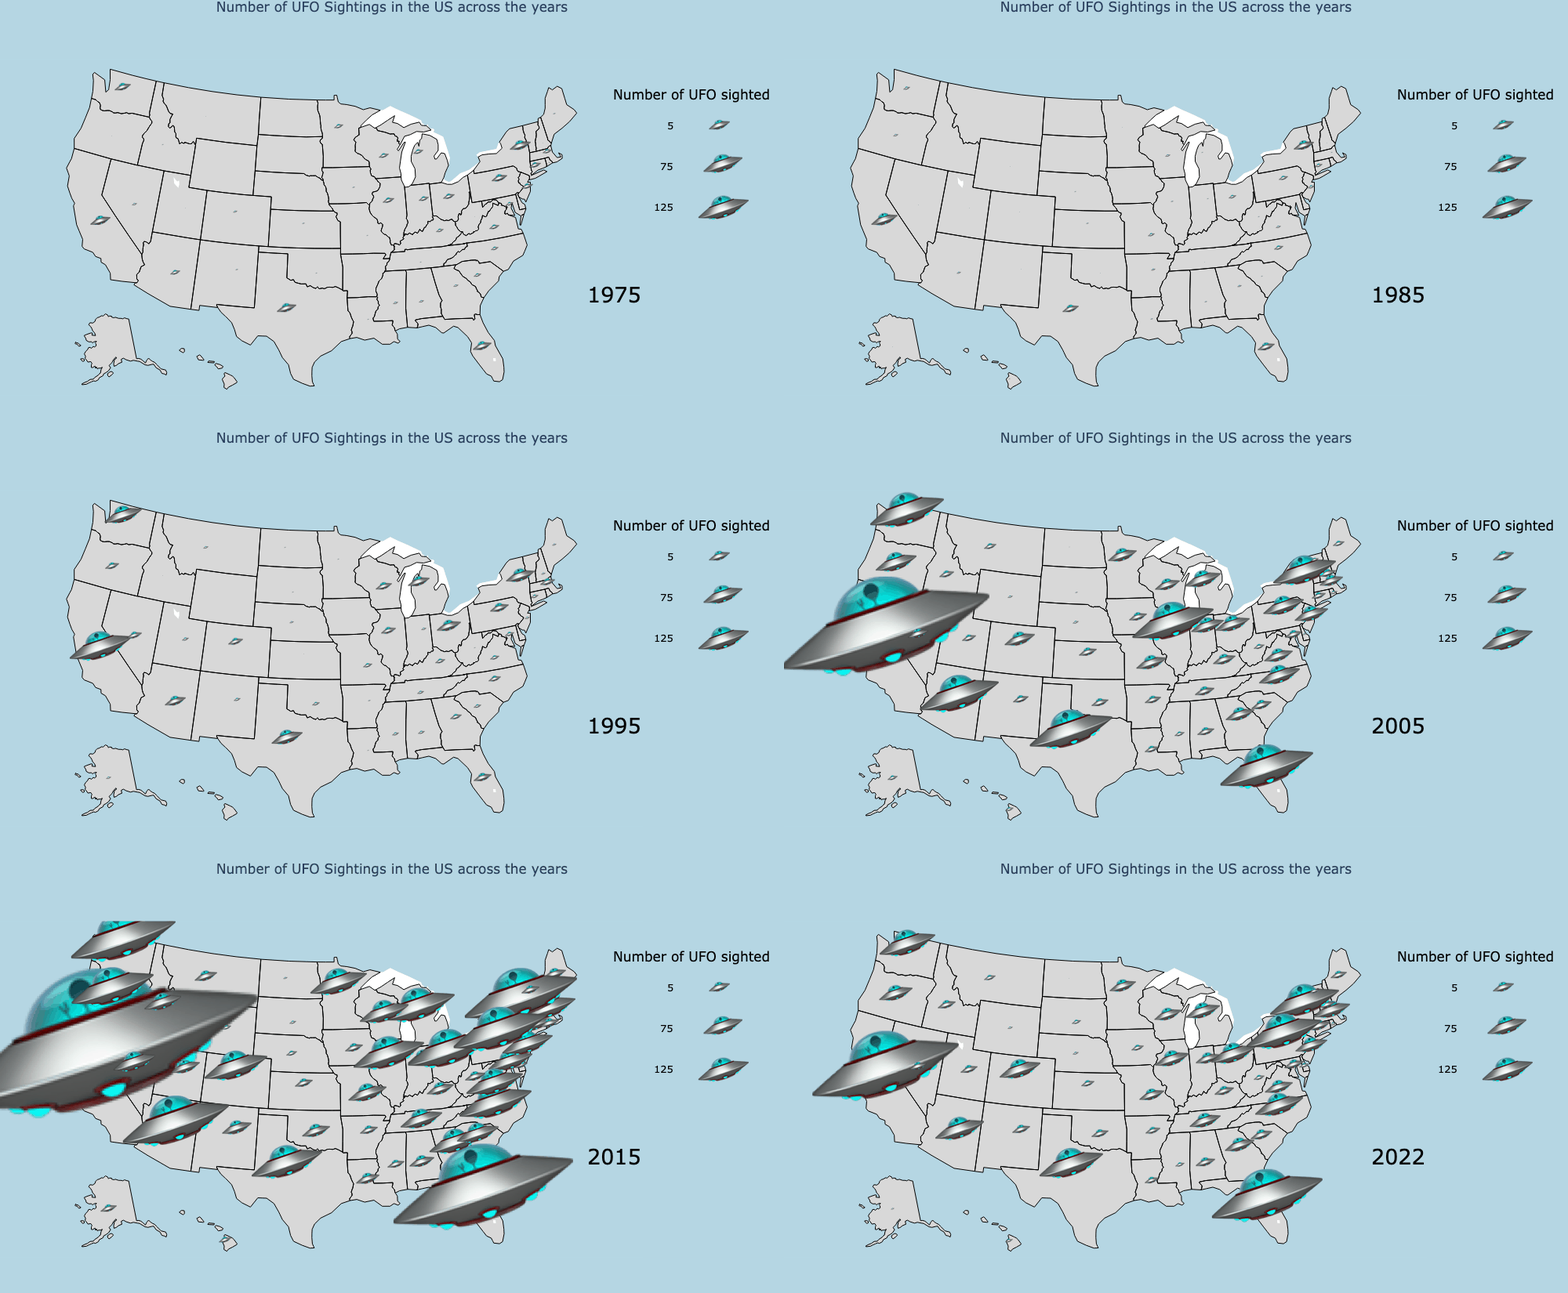
The number of reported UFO sightings in the US has seen a significant increase since the 1970s, across all states. This project aims to analyze this growth trend and identify potential reasons behind it. The data used in this analysis is sourced from the National UFO Reporting Center, covering daily national sightings from 1973 to 2022. As a quick disclaimer, this project and its team members are not attempting to promote any theories about UFOs, including their origins, political implications, and so on. The analysis solely focuses on the sightings and what factors could be driving their numbers.
THE STORY
Embark on an extraordinary journey with four Georgetown University students as they delve into the realm of UFO sightings across the United States. Ever since they were young, these students have always been fascinated by UFOs, aliens, and extraterrestrial life. That being said, they have always dreamt of seeing a UFO in front of them, which prompted them to use their Data Science skills to analyze UFO related data. By visualizing this data, they can increase their chances of actually seeing one!
The Data
This dataset was collected from the National UFO Reporting Center.
About the Data
Brief Information about the Key columns in the dataset
Date
Sighting date reported (1973-2023). Data for 2023 was excluded as the year is still midway through.
Time
Specific time of sighting (by hour and minute).
City
US city of reported sighting.
State
US state of reported sighting.
Shape
Shape of observed UFO.
Duration
Duration of reported sighting. This variable was feature engineered from the "Time" variable.
Summary
A short description of the sighting given by the observer.
Images
A binary variable (Yes/No) describing whether the observer submitted an image of the reported sighting.
Temporal Analysis
Figure 1 shows the temporal trend of reported sightings of unidentified flying objects
(UFOs) from 1973-2022. The graph shows that there was a steady rate of UFO sightings
between 1973 and 1996, numbering in the hundreds annually. But starting in 1997, there
was a sharp rise in the number of sightings that continued every year until it peaked in
2014 when there were close to 8000 sightings reported.
After reaching this peak, there was a decline in sightings for three straight years
until 2017 (see this article for more information), at which point there was a rise in
sightings once more. This phenomenon suggests that the graph may have two key inflection
points: 1996–1997 and 2017–2018. It would be fascinating to find out if these inflection
points hint at any underlying causes that may have influenced the shift in UFO sighting
trends.
Figure 1 as a whole demonstrates a distinct temporal pattern in the quantity of reported
UFO encounters, and these tendencies may call for further examination to ascertain their
potential explanations.
Figure 2 provides a thorough representation of the annual number of UFO encounters in every
state in the US. From it, we may see patterns and trends that are not obvious in Figure 1.
Two primary findings are made once Figure 2 is analyzed.
The first finding is that, since 1996, there has been a consistent pattern throughout all
states, with an upward and downward trend in sightings. This suggests that there may be a
set of common reasons driving the rise of UFO sightings across the United States, possibly
connected to technological advancements or other sociological or environmental factors that
influence how individuals perceive and record UFO encounters.
The second finding is that the highest annual number of sightings regularly came from
California, Florida, and Texas. This conclusion begs the question of whether these states
are more likely to experience UFO sightings or whether they have superior reporting
mechanisms that encourage more people to do so.
Figure 2's comprehensive examination of state-by-state annual trends in UFO sightings allows
for a greater comprehension of the trends and patterns seen in Figure 1 overall. To fully
comprehend the underlying causes of these patterns and trends in UFO encounters, more
research may be required.
A potential cause for such an exponential growth in UFO sightings in the year 2000 is
explained in the "Social" section.
Note: This is our innovative visualization, as it combines the conventional line plots with
area charts and adds an artistic flair to the
traditional line plot. This technique provides a unique and intuitive way to represent the
data,
and is more visually appealing compared to a basic and common multiple line chart.
Additionally, the thickness of the "streams" corresponds to the relative magnitude of the
values,
making it easier to understand the data. Not only does it look great, but it also
effectively
communicates the trends in the data to the audience. Moreover, the streamgraph can also be
viewed in conjunction with the social media/tech graph
because of the similar timelines being investigated. In 1996, UFO sightings take off
exponentially, along with internet usage. Moreover, the 20 states visualized in this graph
follow a very similar trend in UFO sightings throughout 1973-2022. Therefore, the
consistency in the trend of these states is a novel finding, as previous studies have shown
variations in UFO sighting patterns across states when all years are aggregated. This could
potentially suggest a common underlying factor, such as cultural or societal influences,
that could be further investigated in future studies.
Firstly, it may be easier to spot strange lights or objects in the sky during darker hours
due to fewer distractions and more contrast between the sky and any potential UFO, and some
sightings reportedly involve light-emitting objects that are easier to see at night.
Secondly, individuals may be more likely to be outside during evening and overnight hours
when it's cooler and cozier, increasing the possibility of spotting strange objects that
could be mistaken for UFOs.
Lastly, psychological and cultural factors may influence the time of day when UFO encounters
occur, as individuals may feel a greater sense of mystery or interest when seeing strange
objects in the night sky.
Overall, Figure 3 provides insight into the temporal patterns of UFO sightings, and the
potential factors that may contribute to these patterns. Further research may be needed to
understand the underlying causes of these trends and patterns, and to determine if there are
additional factors that influence when and where UFO sightings occur.
Geospatial Analysis
The distribution of UFO sightings across the US states varies depending on the analysis performed.
Initially, we counted the total number of UFO sightings reported in each state from 1973 to 2022.
According to this analysis, which is visualized in Figures 1 and 2, California accounted for around
25% of the total sightings reported and was followed by Florida and Texas. However, this observation
may be biased as it does not take into account factors such as the population and the area of each
state.
To address this bias, we calculated the total sightings per capita for every state for each decade
from the 1970s to the 2020s. We summed the total sightings reported for each state in every decade
and divided the result by the population density of those states. The resulting analysis, depicted
in Figure 3, showed a different picture. The states with the highest per capita sightings were
Alaska, Montana, and New Mexico, while the eastern states of the US had lower numbers of sightings.
This indicates that the previously observed bias was influenced by the population density of the
states.
Overall, the distribution of UFO sightings across the US states is not uniform and is influenced by
various factors. By considering per capita sightings, we were able to gain a better understanding of
the distribution of UFO sightings and eliminate potential biases caused by state population
densities. However, saying that there is a greater chance of observing a UFO in Alaska compared to
California cannot be said confidently as the per capita number might be too high due to such a lower
number of people in that state.
The above map displays reported UFO sightings in the United States, using markers to indicate the
location of each sighting, and allowing for zooming in to view more specific details. The markers
are grouped, enabling visualization of the general density of sightings in various regions of the
country.
Figures 1, 2, and 3 provide a state-centric analysis by showing the number of UFO sightings in each
state. However, Figure 4 provides more detailed information by revealing the cities and counties
with the highest number of sightings. For instance, in California, Los Angeles has the highest
number of sightings (10491), and upon closer inspection, West Hollywood appears to be the area with
the most sightings.
This figure enables a deeper exploration of the possible reasons behind the number of sightings, as
a city-based analysis can be conducted to identify contributing factors.
Weather Analysis
The NUFORC dataset was merged with inclement weather data collected at the daily and city level from
the National Oceanic and Atmospheric Administration API. The aim was to compare the distribution of
reported UFO sightings during clear versus adverse weather conditions across the United States from
1973-2022. By clicking on the "Unclear" bar, one can view an aggregated view of the merged data for
the top 5 most commonly occurring inclement weather conditions, which include windy, foggy, dusty,
hazy, and rainy (in ascending order).
The most interesting aspect of this plot is that when a city faces high winds during a day, fewest
number of UFOs are spotted across 1973-2022, indicating that windy conditions are probably not
conducive for UFOs to fly in. Regardless of what the UFO is and where it originates from, the fact
that it avoids windy weather is a strong argument that these objects might be real and have certain
flight mechanisms that are impacted by wind.
The argument that people are not outside when it's windy is refuted by the fact that the most UFO
sightings occur when the weather is rainy, which is also a weather condition in which people tend to
stay indoors.
Figure 2 illustrates the number of UFO sightings, from 1973 to 2022, in the United States for the top
10
cities, which have highest UFO sightings count, when these cities experienced inclement weather on a
day. This is a
linked view, which suggests that clicking a cell on the heatmap will update the barplot with the
respective City and Weather Condition. Five types of weather
descriptors were analyzed and it was found that, despite inclement weather on a day, Chicago, IL,
reported, on average, the maximum number of sightings out of all the 10 cities.
It is also important to note that the findings in that figure are in accordance with the findings of
Figure 1.
To elaborate , if the weather was hazy or rainy, the number of sightings across all cities was
relatively higher than that of other weather conditions. However, if, during a day, a city
experienced high or damaging winds,
the number of UFO sightings was the lowest across all cities, so much so that for Seattle, San
Diego, Portland, and Los Angeles, there were no reported UFO sightings between the years 1973-2022!


CODE